by Alexander Gloy
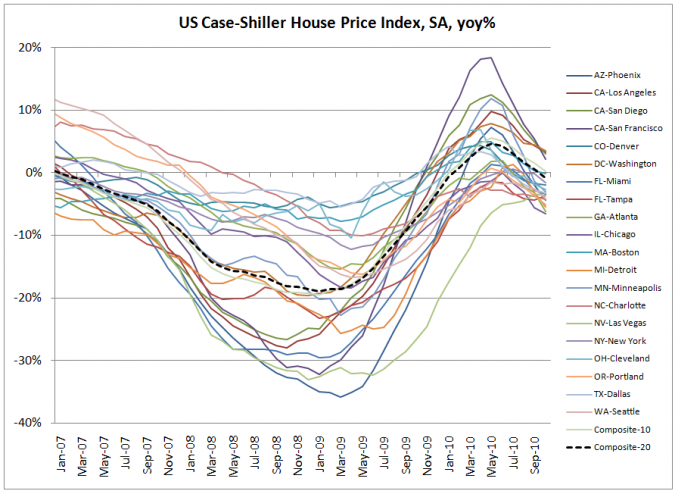
Let’s take a look at the situation after the October data from the Case-Shiller home price index has come in[1]:
You see all major metropolitan areas peaking between March and May 2010 (the end of the first-time home-buyer tax credit). After only 8 months in positive territory, the overall index comprising 20 cities is back into the red (-1% in October). 14 out of 20 regions now show declining house prices.
Prof. Robert Shiller (one of the creators of the index) pointed out that 6 out of 20 cities in the index have hit new lows (even lower than in early 2009). He said that the economy would face “serious worries” if house prices kept falling this fast.[2]
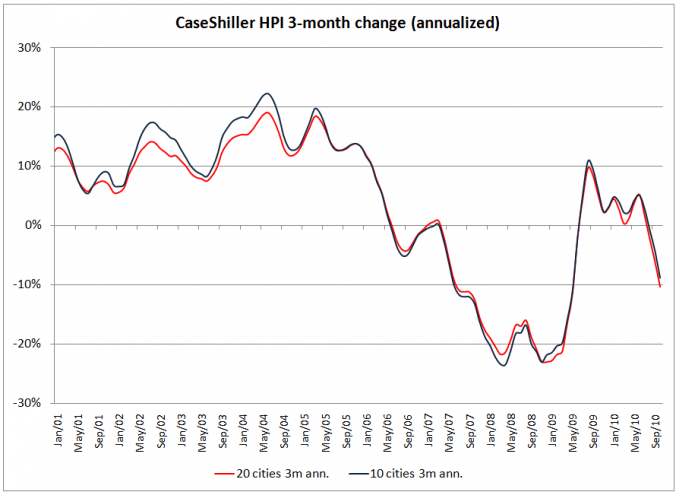
Why did he say “this fast”? To understand, you have to look at the annualized rate of change of the last 3 months[3]. And it is not a pretty picture:
While the 10-city index dropped an annualized 8.8% in the three-month period from July to October 2010, the 20-city index fell at a rate of 10.4%.
The annualized three-month rate of change gave an early warning sign went it went into negative territory in June 2006, while both the 10-city and 20-city only showed declining house prices in January of 2007.
Equally, the three-month rate of change signaled a trend reversal in April, May and June of 2009, while the overall index did not turn positive until February 2010.
Investors would have been wise to heed these signals – both on the way down and on the way up. As declining house prices were the trigger[4] for the biggest financial crisis since the Great Depression it is only a matter of time until financial markets react to the new realities of house prices: a double-dip.
[1,3] Source: StandardandPoors.com, own calculations.
[2] Prof. Robert Shiller, in: online interview with Wall Street Journal, December 29, 2010
[4] “Trigger” (not the only reason)


One response to “US house prices – Roll out the welcome mat for a double-dip”
[…] US house prices – Roll out the welcome mat for a double-dip Alexander Gloy, Lighthouse Investment Management […]