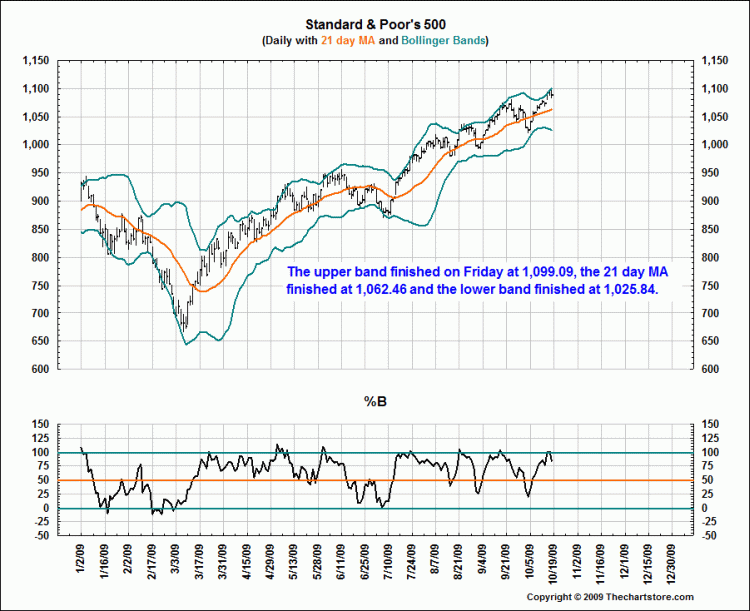
The S&P 500 hit its upper band of 21 day moving average (MA) Bollinger Bands and looks to be on a retreat. This does not mean that the index has to decline (the current high reading could be “healed” by the index going sideways for a few weeks while the upper Bollinger Band continues to go up). But it shows that a further rapid increase in the S&P 500 index is highly unlikely:

Source: www.TheChartStore.com
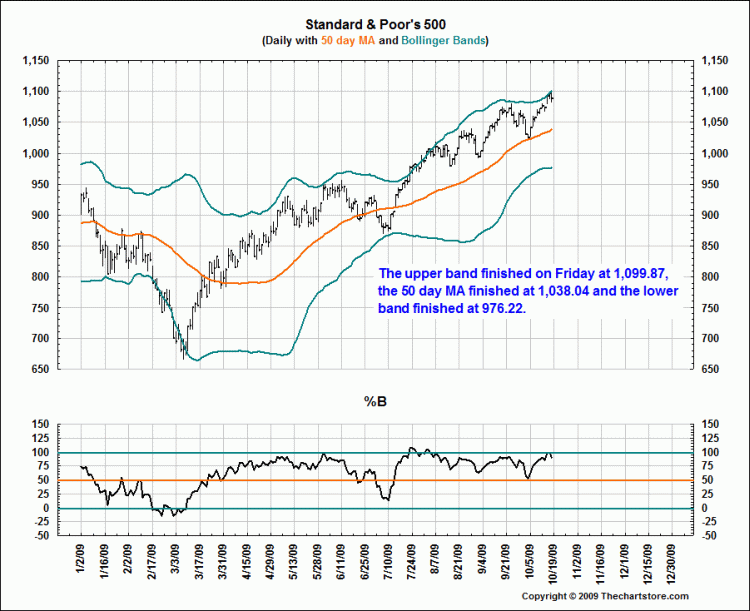
We can do the same for a 50-day period:
Same picture here (limited upside, significant downside):

Source: www.TheChartStore.com
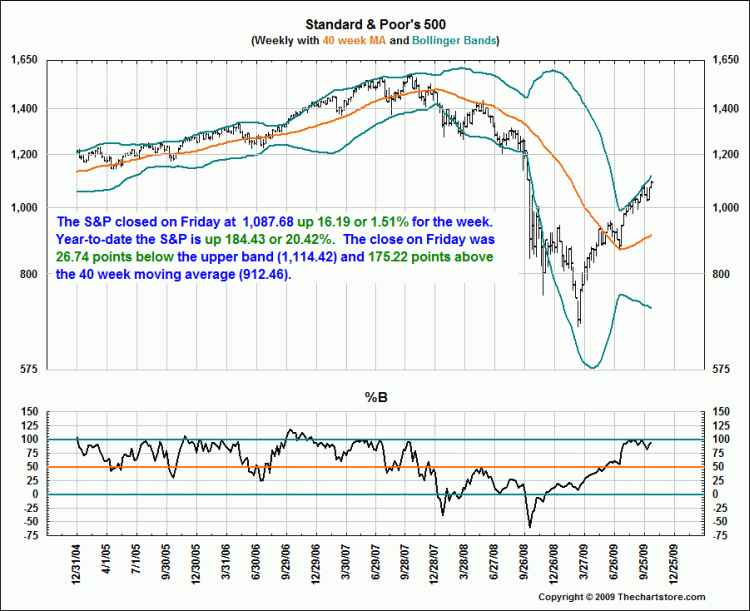
And finally same for the 40-week period: look at the downside potential (without even leaving the lower band):

Source: www.TheChartStore.com
