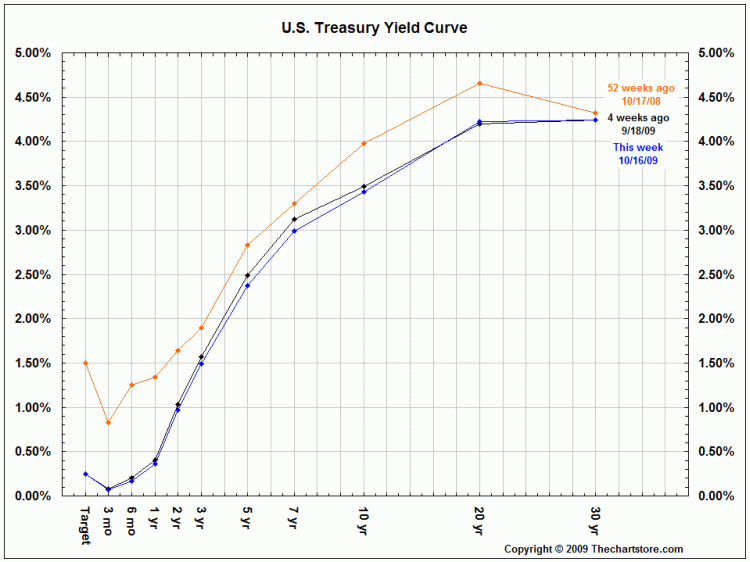
Here’s the current yield curve (blue) compared to 4 (black) and 52 weeks (orange) ago. Not much difference other than the short end (0-2 years):

Source: www.TheChartStore.com
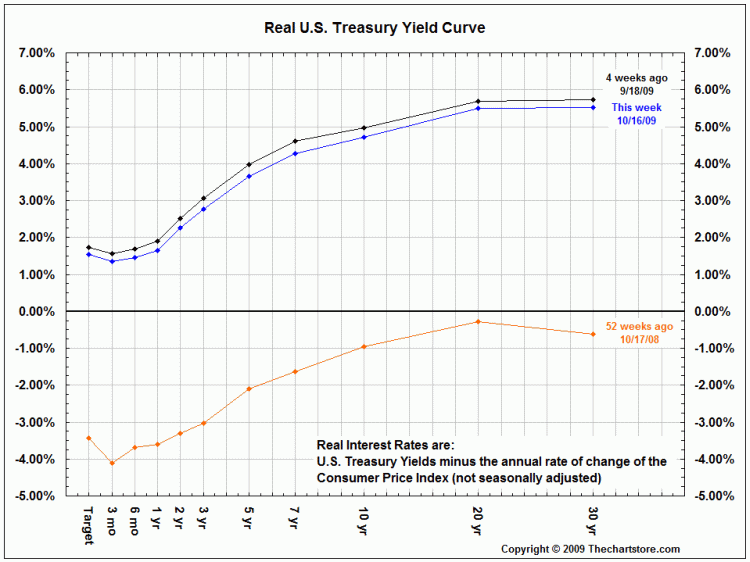
Now let’s look at it in real terms (after subtracting inflation):

Source: www.TheChartStore.com
Real yields were negative a year ago (due to the still high rate of inflation). This can be explained by lag effects (takes time for a falling oil price to work through to consumer products) and the bond market pricing in expectations of future low rates of inflation. A 5% real yield on 10 year Treasuries doesn’t look so bad after all, no? (This of course assumes that moderate deflation continues to persist until maturity – which is unlikely.)
