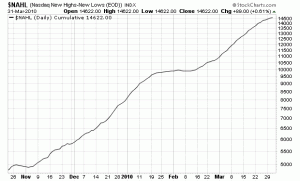
A stock market making new highs should have more individual stocks making new highs than new lows. If you measure that the difference between new highs and new lows accumulated over time you get the following picture:

As you can see, the strong market correction in February shows up merely in a sideways movement of this indicator. It is hence of limited usefulness.
