Looking at the volume of all equity options traded you can calculate the ratio of put options to call options. Call buyers expect strongly rising prices (let’s call it “+2” on a bullish-ness scale) while call sellers expect falling, flat or slightly rising prices (-0.5). Combined, their expectations can be summed up as +0.75.
Put buyers expect quickly falling prices (-2), while put sellers expect rising, flat or slightly falling prices (+0.5) for a combined “expectation” value of -0.75.
So even as every buyer meets a seller, the embedded expectations do not cancel each other out. Call buyers and sellers are more positive on the future direction of the market than put buyers and sellers.
By calculating the ratio between the number of traded call and put options we can gauge market expectations and take a contrarian position (since the majority of market participants is usually wrong). A high ratio of puts compared to calls means somber mood, hence prices might go up.
However, there is a big difference between options on individual equities (stocks) and those on indices.
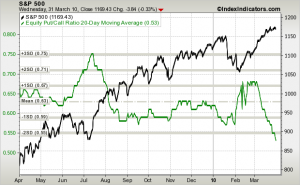
First the EQUITY put-call ratio (green, with the S&P 500 index overlay in black):

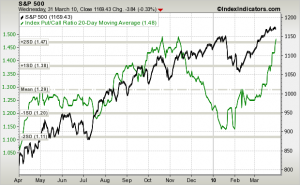
Now take a look at the ratio on INDEX options:

The ratio on index options seems to have gone the exact opposite way the equity options ratio does. Interpretation: individual (retail) investors like to speculate in specific stocks (and have become more bullish recently, pushing the number of puts vs calls down) while professional investors (funds etc) have become more cautious amid the recent rally (buying more index puts to lock in their gains and/or to protect from future market drops).
Conclusion: we would not put too much emphasis on the put-call ratio – but it is a useful addition. The equity put-call ratio seems to be somewhat useful as a contrary indicator. It currently suggest we are at a market top.
