Stocks go up and down. If you calculate a moving average (say, last 50 or 200 days), the stock will sometimes be above, sometimes below that average. One thing is sure: the stock will meander around its average, and it will always come back to its average. If it moves far away from the average (over-bought or over-sold situation) there is a high likelihood it will come back.
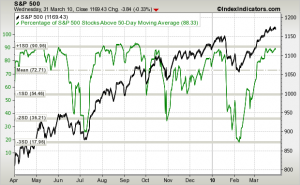
You can look at the members of a stock index (e.g. S&P 500) and count how many stocks are currently ABOVE their moving average (the value will be between zero and 100):
% of stocks in S&P 500 above their 50-day moving average (green):
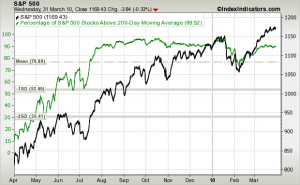
Or, on an longer period, above a 200-day moving average:
But, as you can see, both indicators can remain in “overbought” territory (e.g. July – October 2009) for quite some time – and the market can still go up further.
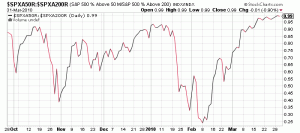
So what if we calculate the ratio of the 50-day and 200-day moving average numbers:
The result is a better timing indicator for overbought and oversold markets. It currently screams “Sell”.


