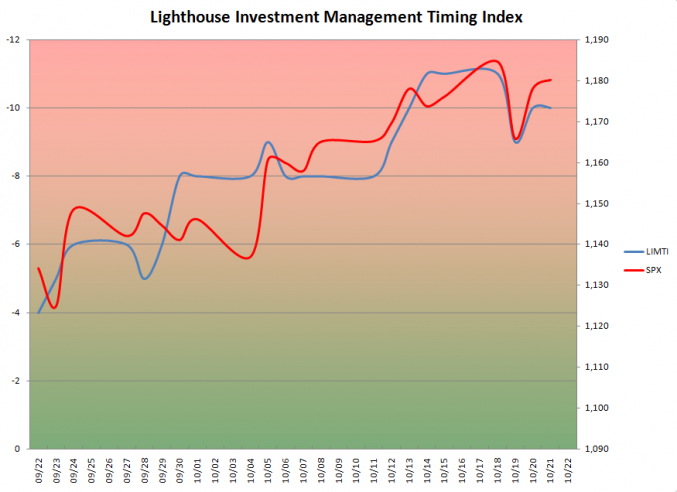
Presenting the LIMTI (Lighthouse Investment Management Timing Index)
Apart from fundamental considerations markets move in waves (prevailing bearishness or bullishness). As supply is often constrained (number of shares, bonds, currencies, gold etc) the change in investor sentiment has to happen via the price.
Traditional sentiment polls might be misleading, as many portfolio managers are constrained by their mandates (for example not to hold more than 5% in cash), hence stating that one is “bearish” might have absolutely no impact on the actual stance (has to hold equities anyway).
The LIMTI is supposed to give indications on when to buy or sell investments related to the S&P 500 index. It is made up of 11 individual indicators (for example put-call ratio, % of stocks in the S&P 500 index trading above their 50-day moving average etc). Each index is assigned values from -2 (two standard deviations or more below its mean value) to +2 (accordingly). Theoretically the index can vary from -22 (11 x -2) to +22.
So far I have equal-weighted all individual contributors. However, some indicators work better than others. This will be monitored and fine-tuned going forward (by under-weighting less “successful” contributors and overweighting those with a good track record of pointing out tops and bottoms.
I have not back-tested the LIMTI, but the individual contributors have been back-tested for 3 years. This time period has been characterized by two extreme events (Lehman chapter 11 and an 80% bull market), so some “trigger levels” might be too wide. We’ll see. It’s an experiment.
On October 21 the LIMTI showed a reading of -11, which leads to the conclusion the market is overbought and ripe for a correction. Out of 11 contributors only one is positive and two show a neutral reading.


One response to “Presenting the LIMTI”
[…] Boomerang bail-out […]