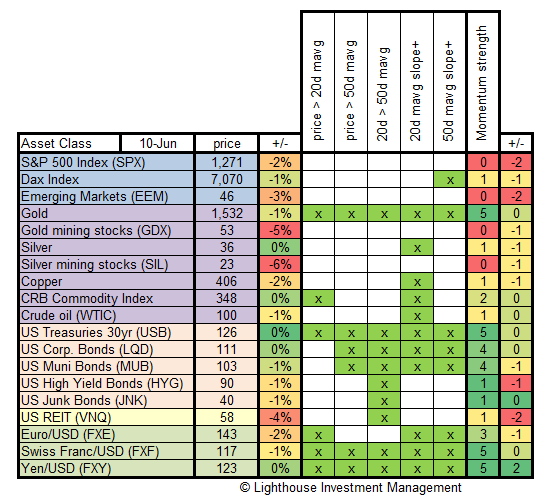
Each week we test major asset classes for the strength of their momentum. We check:
- is current price above 20-day moving average?
- is current price above 50-day moving average?
- is 20-day moving average above the 50-day moving average?
- does the 20-day moving average have a positive slope (i.e. is it rising)?
- does the 50-day moving average have a positive slope (i.e. is it rising)?
If the answer is yes, we give one point. If all conditions are fulfilled then the asset class has five points. This is considered a very strong momentum. Investors believing in strong trends would invest in assets showing a strong (positive) momentum.
We also track weekly price change (%) and the change in points.
Here is the latest table:
- Gold- and silver mining stocks the worst performers (despite gold and silver being stable)
- US Treasuries best performing asset class (10-year yield below 3%)
- Momentum has deteriorated across all “risk” asset classes, especially US and emerging market stocks (down 2 points to zero).
- Strongest momentum in gold (yes, still intact), US Treasuries, Swiss Franc and Yen (biggest improvement in momentum)
Conclusion:
Momentum analysis suggests to be invested completely risk-averse. It will be interesting to see if gold can keep its momentum despite other commodities selling off.

