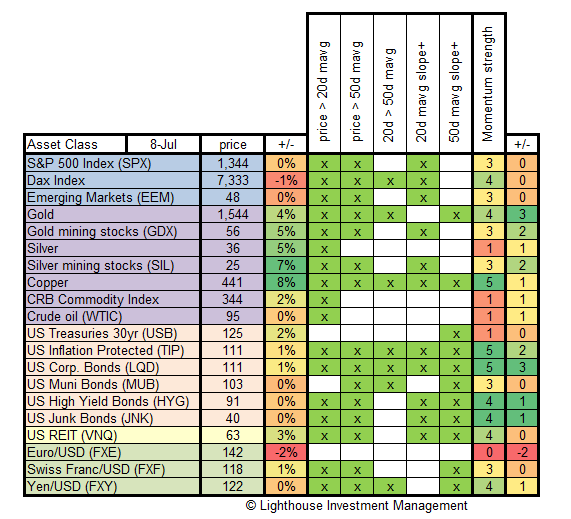
Each week we test major asset classes for the strength of their momentum. We check:
- is current price above 20-day moving average?
- is current price above 50-day moving average?
- is 20-day moving average above the 50-day moving average?
- does the 20-day moving average have a positive slope (i.e. is it rising)?
- does the 50-day moving average have a positive slope (i.e. is it rising)?
If the answer is yes, we give one point. If all conditions are fulfilled then the asset class has five points. This is considered a very strong momentum. Investors believing in strong trends would invest in assets showing a strong (positive) momentum.
We also track weekly price change (%) and the change in points.
Here is the latest table:
Observations:
- After a huge rally into the end of the quarter equity markets went more or less sideways compared to a week ago.
- Of particular interest is the strong performance of commodities, led by copper and precious metals (however not joined by oil).
- US Treasuries recovered from a sell-off, mirroring moves in the equity markets.
- The Euro stands out as the largest loser as fears regarding Italy’s debt and banks spread on Friday.
Conclusion:
- Momentum has improved for commodities and generally anything related to risk.
- The Euro, Silver, CRB commodity index, oil, US treasuries show weakest measurement of momentum
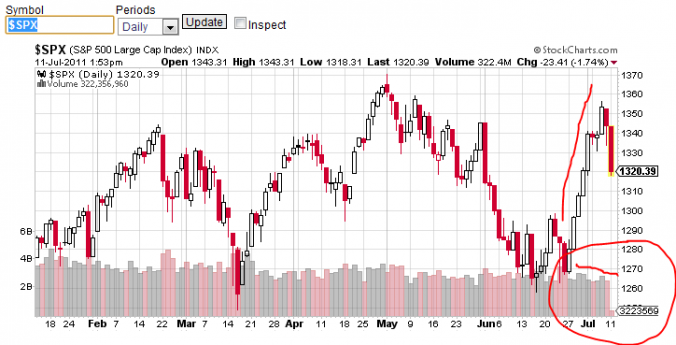
- I am willing to go out on a limb and say that the recent rally was end-of-quarter window-dressing and / or short-covering. Normally you would expect to see increasing volume with rising equity prices. This has not been the case:
Before reversing my cautious stance on equities and the Euro as well as long-positions in US treasuries I would need to see new highs in the S&P 500 index for the year (1,370) combined with decent volume.


