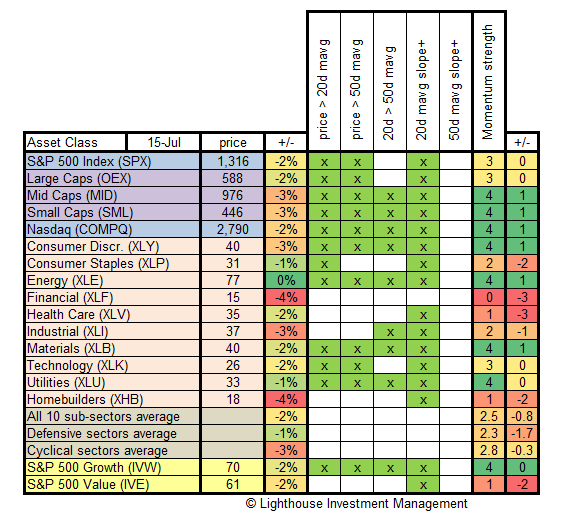
Each week we test major asset classes for the strength of their momentum. We check:
- is current price above 20-day moving average?
- is current price above 50-day moving average?
- is 20-day moving average above the 50-day moving average?
- does the 20-day moving average have a positive slope (i.e. is it rising)?
- does the 50-day moving average have a positive slope (i.e. is it rising)?
If the answer is yes, we give one point. If all conditions are fulfilled then the asset class has five points. This is considered a very strong momentum. Investors believing in strong trends would invest in assets showing a strong (positive) momentum.
We also track weekly price change (%) and the change in points.
Here is the latest table:
Observations:
- Financials, Home Builders and Industrial stocks were the weakest.
- Energy, Consumer Staples and Utilities fared best.
- Large caps slightly outperformed small and mid caps.
- Defensive sectors clearly outperformed cyclical sectors.
- Little difference in growth versus value was observed.
- Overall stock market momentum increased slightly; many individual sectors however do not look healthy as they lost considerable momentum.
Conclusion:
- Momentum-oriented investors would be advised to overweight defensive sectors except for Healthcare (which had quite a break-down in momentum over the last week).

