Before you trash me in the comments, hear me out.
It started off with Ray Dalio’s “beautiful deleveraging”, which inspired this post.
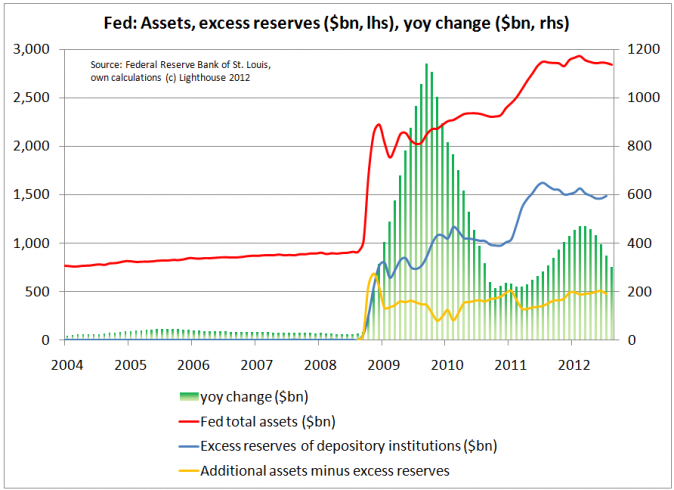
Since the financial crisis, the Fed has increased its balance sheet from $900 billion to $2.9 trillion (red line in below chart). The difference is $2 trillion (or 13% of GDP).
When the asset side of the Fed’s balance sheet grows, so must liabilities. The Fed’s liabilities consist mostly of money in circulation. So we can assume that $2 trillion in additional money has been pumped into the economy.
Or has it?
When the Fed buys bonds, it does so from “Primary Dealers” (21 global financial institutions). They hand over the bonds and get a corresponding credit on their account with the Fed. The Primary Dealers might then purchase some other securities with that money (which then gets credited to another bank’s account with the Fed).
And that’s where the buck stops. Three quarters of the money “printed” never make it into the economy. They remain as excess reserves (reserves in excess of banks’ minimum reserve requirements, blue line) in accounts at the Fed.
Hence, of $2 trillion additional money, only $500 billion (yellow line) ended up outside the Fed. Why? Banks could use those reserves for lending, but there is no demand for additional loans (from customers with sufficient debt bearing capabilities).
So if the money can’t find its way out of the Fed – how is money created then? What is money?
To understand, we have to take the example of buying a car.
In the US, literally nobody purchases a car with money form a savings account. The ability to purchase a car depends on the availability of credit. No credit, no car.
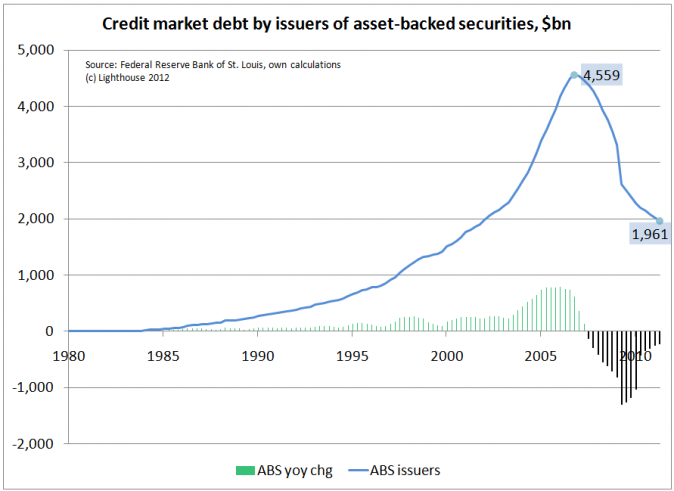
Credit availability depends on issuance of debt. Take a look at debt outstanding by ABS (asset-backed securities) issuers over the last 30 years:
ABS Credit market debt outstanding fell from $4.5 trillion at the peak in April 2007 to $2 trillion. That’s a decline of $2.5 trillion. This is money not available for purchases. It dwarfs the $500 billion pumped into the economy by the Fed.
Debt is money. The amount of debt outstanding controls the amount of money available for purchases, and hence for the size of the economy.
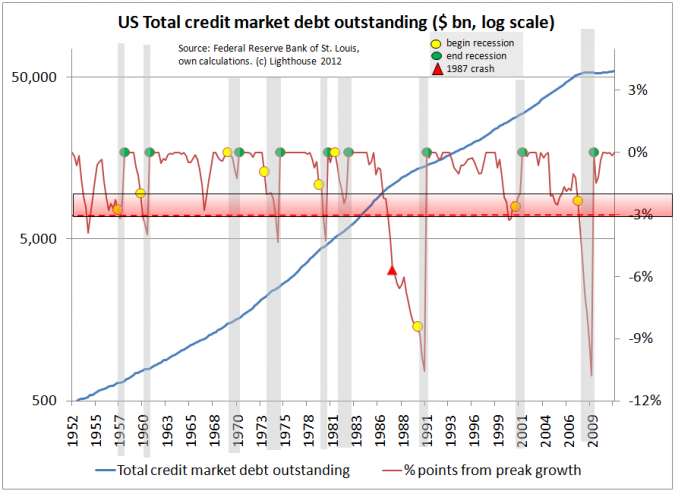
In addition ABS issuers there is debt by households, non-financial and financial corporations as well as the government sector. By adding them up you get the big picture: the total credit market debt outstanding (TCMDO):
TCMDO is the blue line, on a log scale. The red line is the change in the annual growth rate of TCMDO, measured from the prior post-recession peak growth rate. You will notice that every recession over the last 60 years, with the exception of 1970, coincides with a slowing of the growth rate by at least 2%-points. The red triangle depicts the 1987 crash, which followed a period of serious slowing in the rate of TCMDO growth.
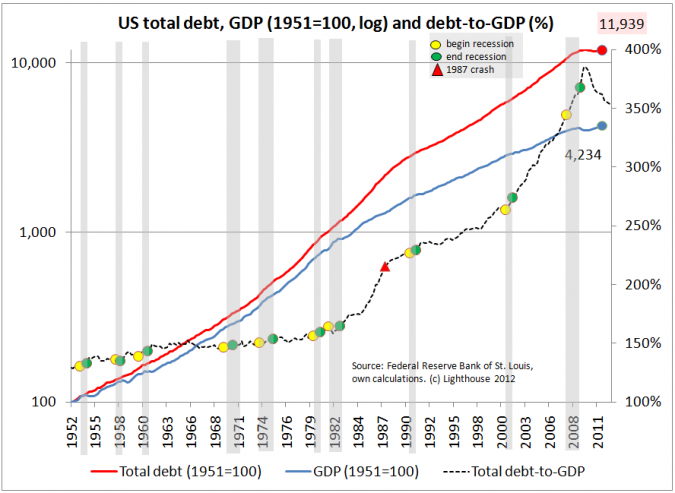
Up until 2009, total credit market debt outstanding has never declined. The ratio of TCMDO to GDP continued higher and higher, at accelerating speed:
Has debt-to-GDP, or the debt-bearing capability of the US economy, hit a ceiling?
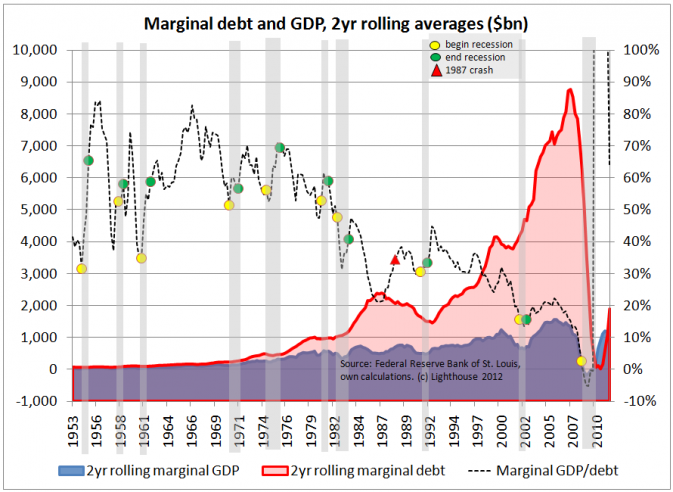
Look at how little additional GDP (blue area, below) we obtained in comparison to ever increasing amounts of additional debt (red area):
The dotted black line is the marginal utility of debt (right-hand scale). Think of it like this: how much additional GDP do you get out of one dollar of additional debt (in %). In 1992, for example, you get $0.30 in additional GDP for every additional dollar of debt.
Problem: this marginal utility of debt has trended lower and lower over the years, and actually reached zero in 2009.
Meaning: you can add as much debt as you want, and it still won’t give you any additional GDP.
To repeat: no amount of additional debt seems to be able to get economic growth going again.
That is a dramatic revelation. We might have reached the maximum debt-bearing capability of the economy. If true, no growth is possible unless debt-to-GDP levels fell back to sustainable levels (in order to restart the debt cycle). This could take years.
At this point, the only way to reset the debt cycle is to get rid of debt.
Ray Dalio correctly describes the three options available:
1. Austerity: this would be painful and take quite some time (the Europeans are going down this path)
2. Restructuring: requires write-downs and losses for bond investors (which are not being allowed to happen for fear of systemic risk)
3. Printing money: Inflation. Better yet: hyper-inflation. You have to destroy the value of debt fast enough before debt service costs, due to rising interest rates, drive the government into insolvency.
In the US, (1) and (2) are not happening. That leaves (3).
As shown above, the amounts needed for the Fed to be able to create inflation are much, much higher than what we have seen so far. And it is not guaranteed to work. Destroying the trust in the value of a fiat currency is a dangerous experiment with mostly adverse consequences.

2 responses to “Analyze this: The Fed is not printing enough money!”
[…] Lighthouse Investment Management A guiding light in the investment ocean Skip to content HomeAbout UsBiosAsset ManagementPhilosophyStrategyBlogContact UsLinks ← Analyze this: The Fed is not printing enough money! […]
[…] week’s chart is from a ZeroHedge.com post from August by Alexander Gloy of Lighthouse Investment Management (found via Things That Make You Go Hmmm…). I have yet to crunch the numbers myself, but the […]