Part 1
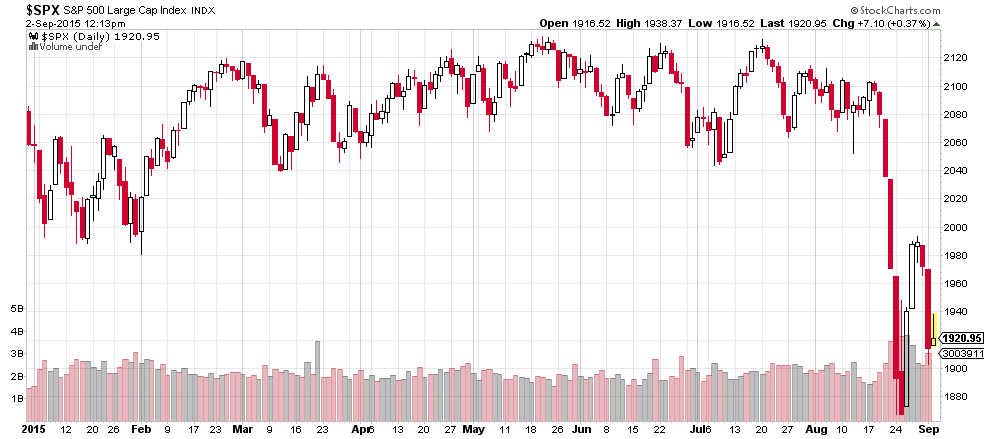
Most of the year, the S&P 500 Index traded sideways in a narrow range (+- 3% from end of 2014). Then, suddenly, this:
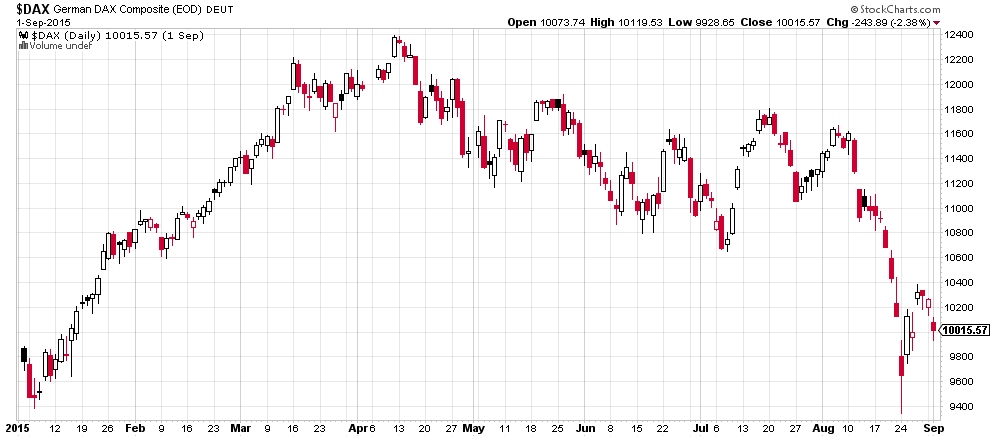
The German DAX-Index had been up 26% by April, but had to give up all of its gains:
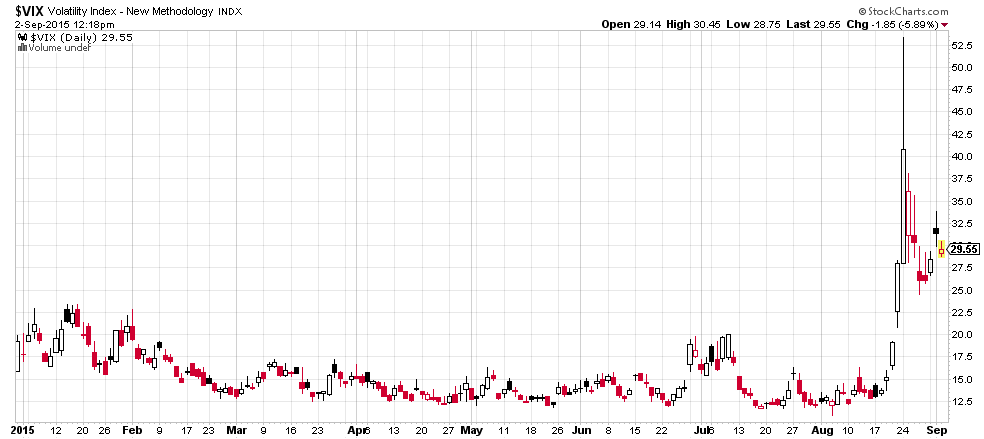
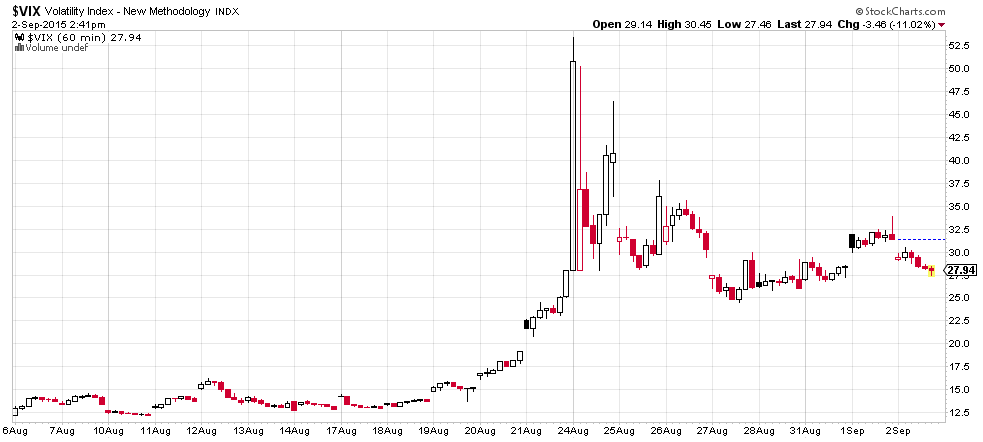
A measurement of expected volatility, the VIX-Index, surged to the highest level since 2009:
Seemingly out of the blue, something has rattled markets. But what happened? There was no major bankruptcy, or disappointing company results, or nasty surprises on the macro front. The Fed keeps pushing out its first rate hike further and further; the IMF is actually begging the Fed to delay any rate hikes until 2016.
I have three theories to offer:
- Flash-crash induced by high-frequency traders and panic-covering of short positions in volatility products
- US and China mutually crashing each other’s stock markets in an escalating financial war over AIIB and SDR
- The appreciation of the Chinese Yuan versus other Asian currencies hurt Chinese exports and forced the PBoC to devalue the Yuan. This has caused the end of the largest carry-trade in history.
If #1, then the market should recover quickly. If #2 or #3, then more trouble lies ahead. Let’s look at the details. This write-up got a bit long, so I will deal with #2 and 3 in a separate post.
The Flash Crash of August 24
In the three days leading to the flash crash on Monday, August 24, US equity markets begin losing ground:
After many months of being subdued, observed and implied volatility of options suddenly spikes from 12 to over 50 in the matter of hours. That made options, both calls and puts, suddenly much more expensive:
Small Excursion into Volatility
(You may skip this paragraph)
What does implied volatility mean? It’s not a concept that is easily understood by casual investors. Let me try to explain.
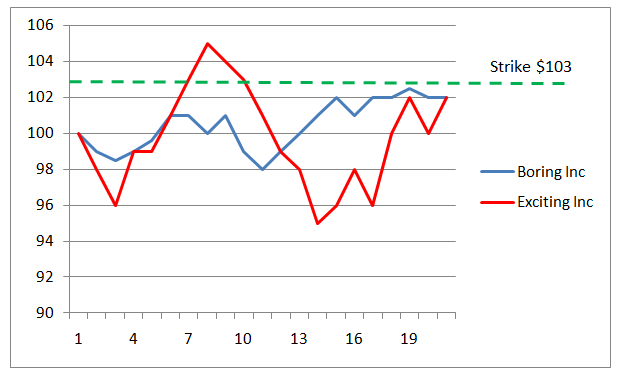
Let’s say there are two stocks, Boring Inc and Exciting Inc., both trading at $100. You believe their stock prices will go up. You buy call options giving you the right to buy each at a strike price of $103.
Despite the fact that both stocks start trading at $100 and end at $102, the call options on “Exciting Inc” will most likely be more expensive than those of “Boring Inc”. Why? The share price of “Exciting Inc” is simply more volatile; it has larger swings. That increases the likelihood of the share price moving above the strike price ($103) during the lifetime of the option. For the owner of options in “Boring Inc” it never made sense to exercise his option (buy at $103) since the share price never exceeded that level. It doesn’t matter that both stocks ended at the same price ($102). Everything else equal, options on volatile stocks are worth more than options on boring stocks.
At an implied volatility of 16 you would be paying a fair price for an option if the stock price had moves larger than 1% (16 divided by square root of 256 trading days) on one third of trading days (33.3% = one sigma). Ergo, the stock price should move less than 1% on the remaining two thirds of days.
It is impossible to know in advance on how much a stock will move in the future. But the price of an option today has an imbedded assumption on its future swings, hence the name implied volatility. You can then make a wild guess and say “this stock is never going to move more than 3% on at least 10 days in September” and not buy (and rather sell) that option.
Looking back, you can measure volatility. It’s nothing else than the standard deviation. It’s then called historic, or observed volatility (as opposed to implied, or expected volatility embedded in option prices).
Increased levels of volatility make both calls and puts more expensive. Hence those who wish to protect their portfolio from losses (by purchasing puts) suddenly are facing higher costs.
Back to the main story:
August 24, 2015
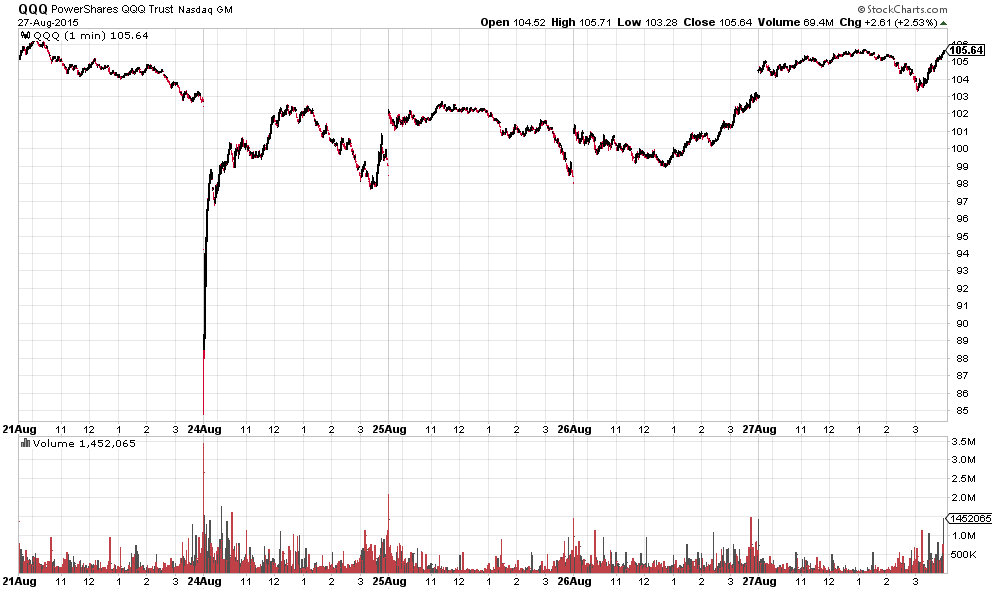
On Monday morning, Chinese equities are selling off. The Shanghai Composite Index loses 8.5%. US equity futures are limit down (-5%) even before Wall Street opens. For the first time in history, trading in all four major US stock market futures (S&P 500, Dow Jones, Nasdaq-100 and Russell 2000) is being halted. That means stock prices have to begin trading without knowing where the fair price relative to futures would be. Arbitrage or hedging via futures is impossible.
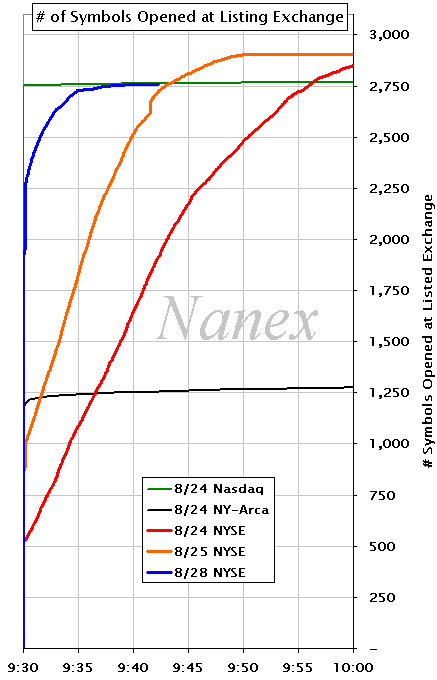
The New York Stock Exchange (NYSE) imposes “rule 48”, which allows stocks to open promptly without price indications. Still, many stocks and ETF’s listed on the NYSE open only after delays of up to 30 minutes (see red line below; compare to blue line on a ‘normal’ day):
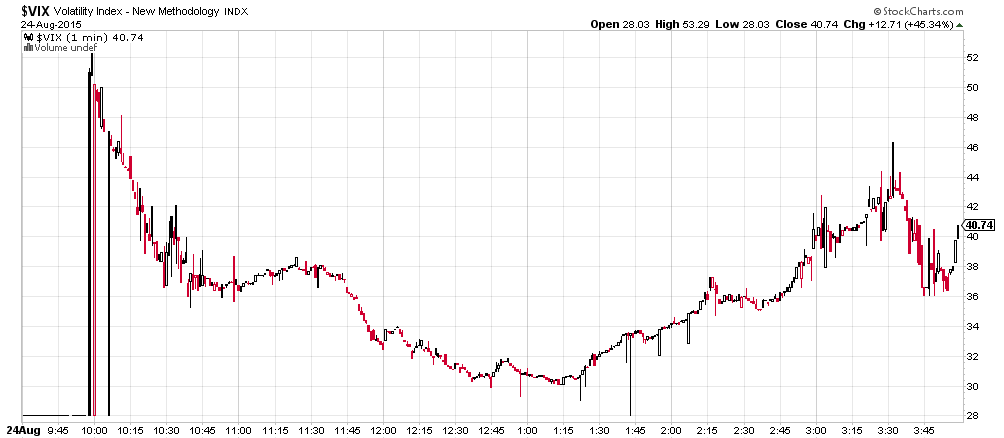
Nothing instills more panic among investors than not being able to sell. The CBOE (Chicago Board of Options Exchange) was unable to compute the VIX index for the first 30 minutes “since it was too volatile” (talk about irony):
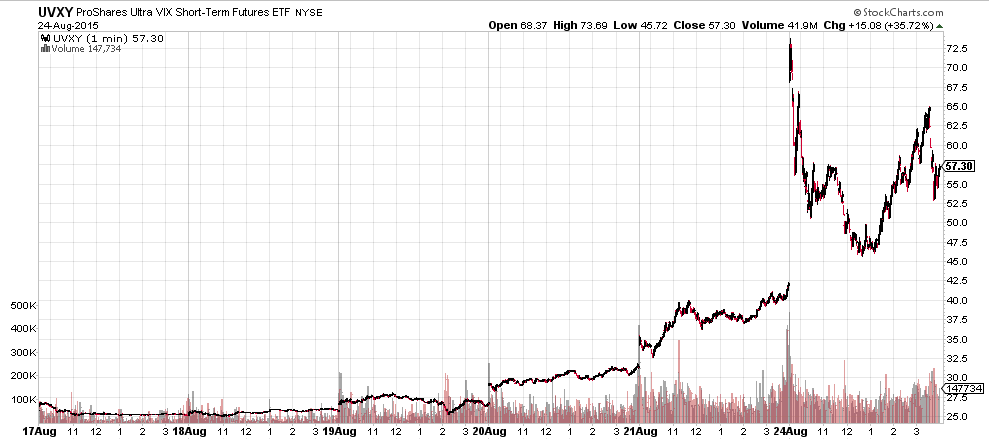
Meanwhile, ETF’s (exchange-traded funds) on volatility were trading, without knowing where the underlying (VIX index) was. Over the first 30 minutes, more than 5 million shares of UVXY (ProShares Ultra VIX Short Term Futures ETF) and more than 30 million shares of VXX (iPath S&P 500 VIX Short-Term Futures ETN) were traded:
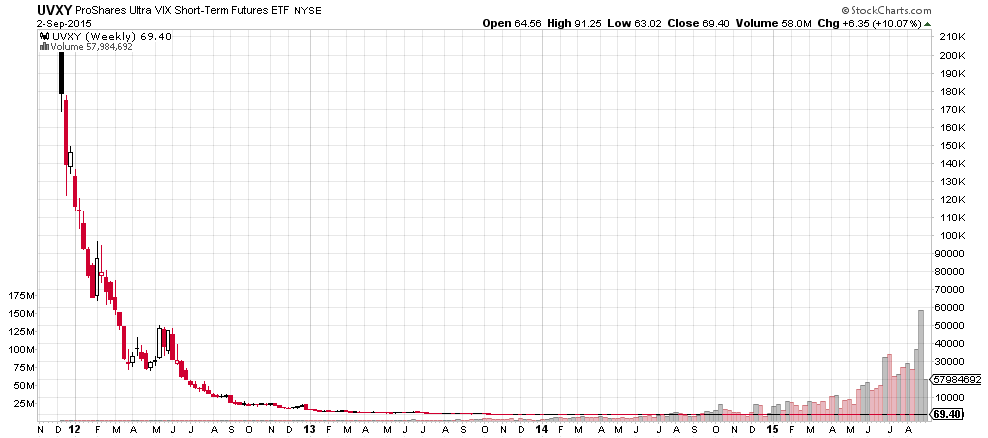
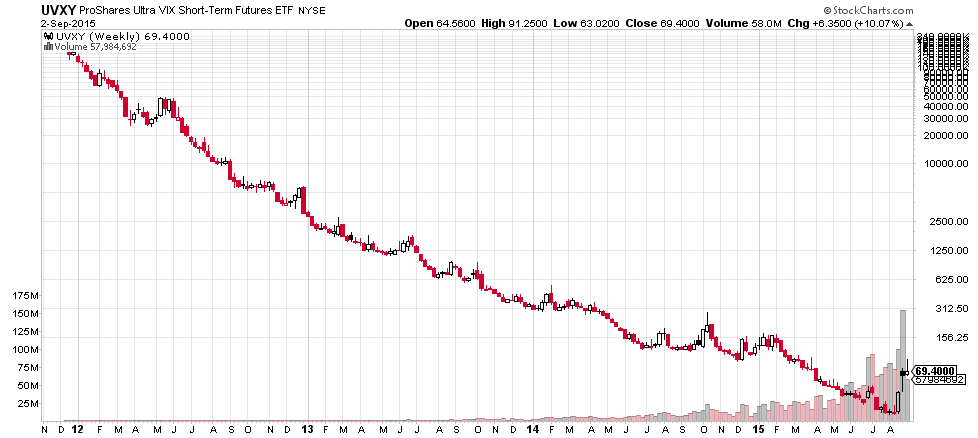
As you can see above, the UVXY ETF almost tripled in price in less than 5 days. You might not be aware of the “special features” of this ETF. Since inception in 2012 its price had fallen from (split-adjusted) $210,000 (yes, as in a fifth of a million) to $24:
Or, if you prefer a logarithmic scale:
So it is the perfect example of a “wasting asset”. Still, $300m of investor’s money sits in this ETF (and $1bn in its brother VXX). What do speculators do with such a loyal wasting asset? They short it. Or sell calls on it. Yes, you can trade options on a levered ETF on a future on the expected standard deviation of options on an index of stocks. It’s a derivative to the fifth power.
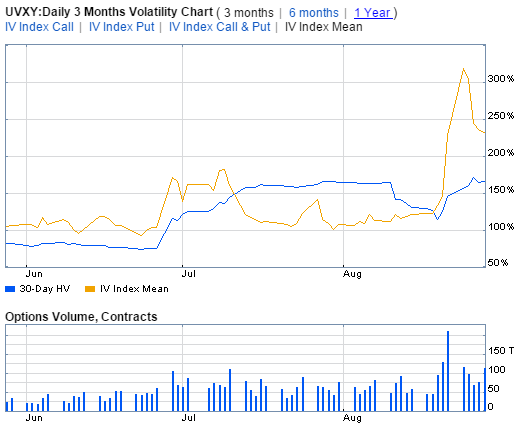
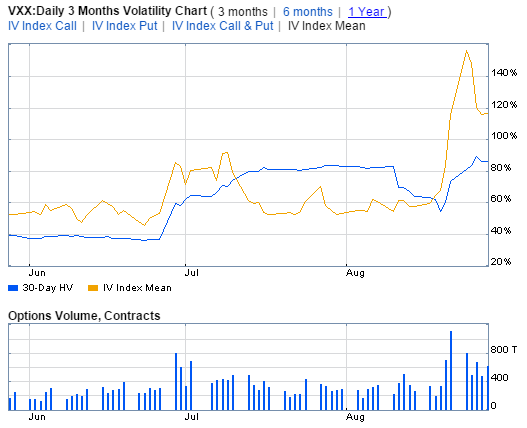
The volume in options traded on VXX and UVXY was larger on Friday, August 21st (the trade day before) than on the actual Flash Crash. Which is unusual. These charts show volume up to Friday, August 28th (so the Flash Crash is the fifth volume bar from the right):
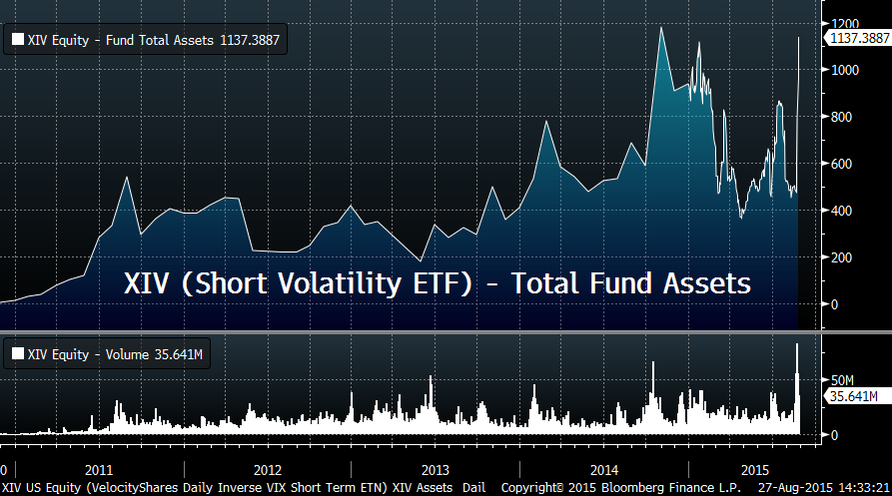
Also, the assets under management in a different, short-volatility ETF (XIV) doubled to more than $1bn in the week before the 24th:
By shorting (or writing calls) on a wasting asset you can pick up small, but decent amounts of money every month. But when it goes wrong, you can lose a ton if you cannot cover your trade. The saying “picking up pennies in front of a steam roller” applies. Is this what caused the Flash Crash? Not by itself (the amounts involved are too small), but it probably aggravated the situation.
Blue Chips Can Flash-Crash, Too
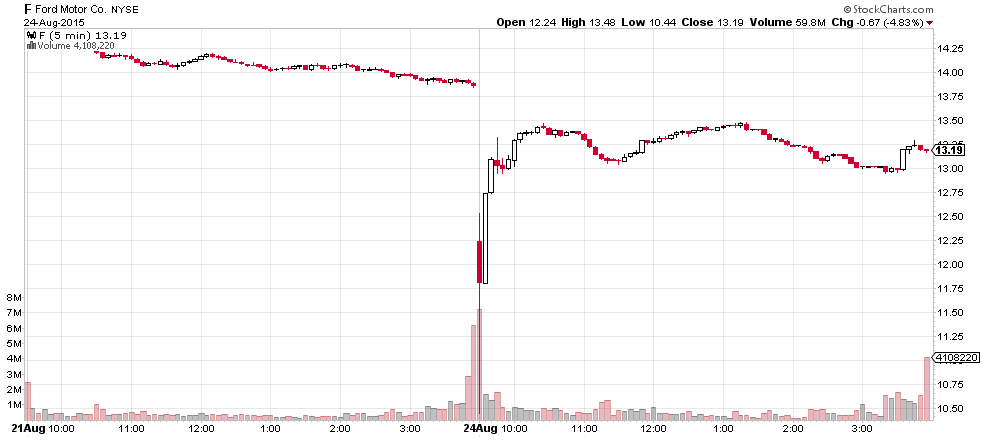
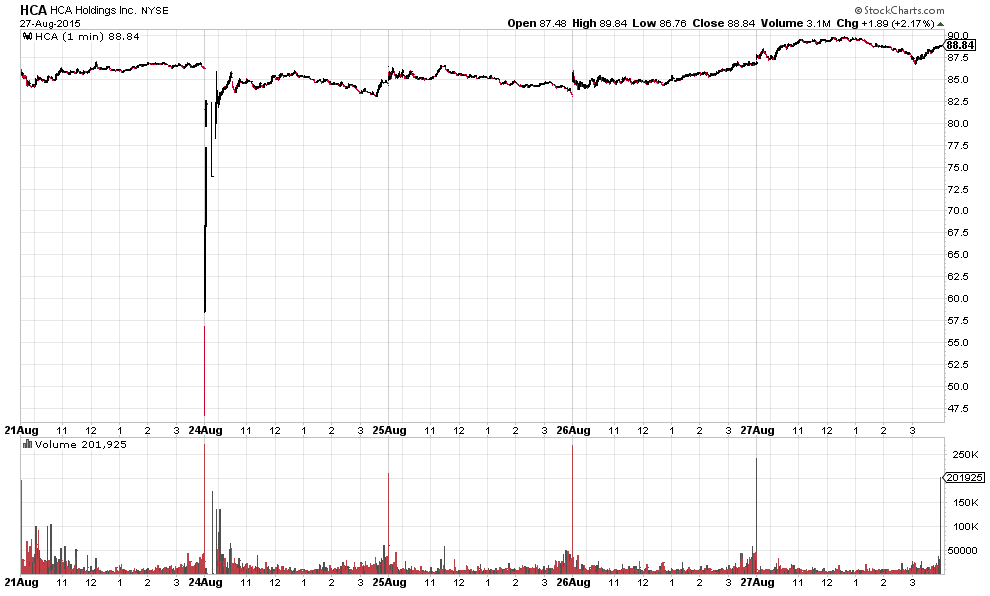
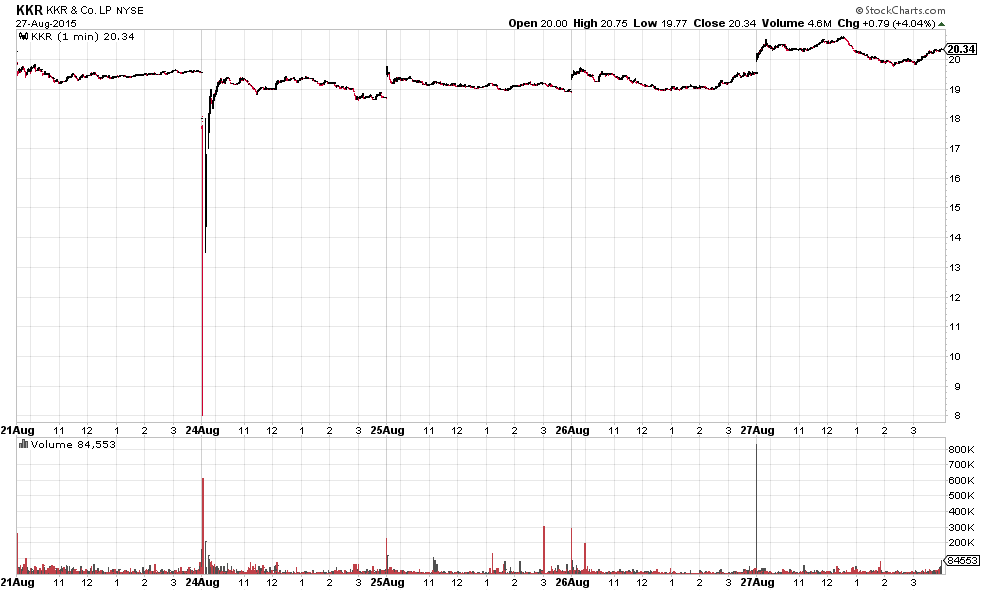
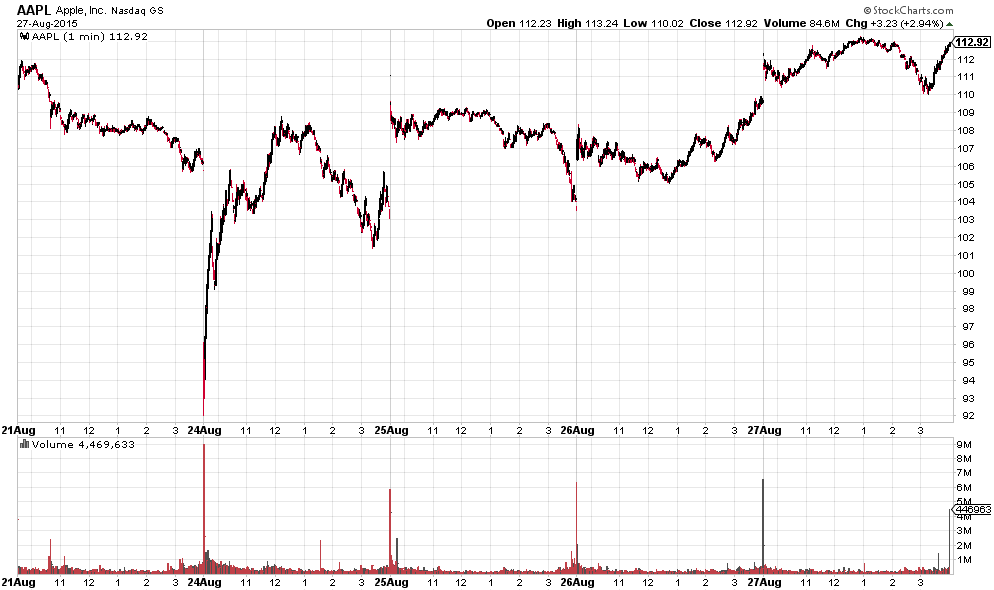
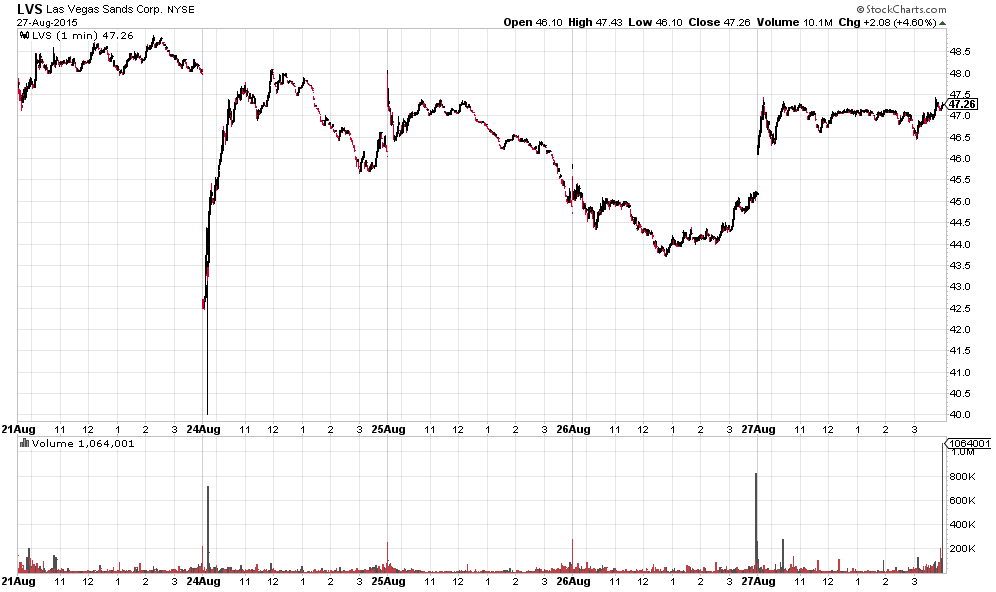
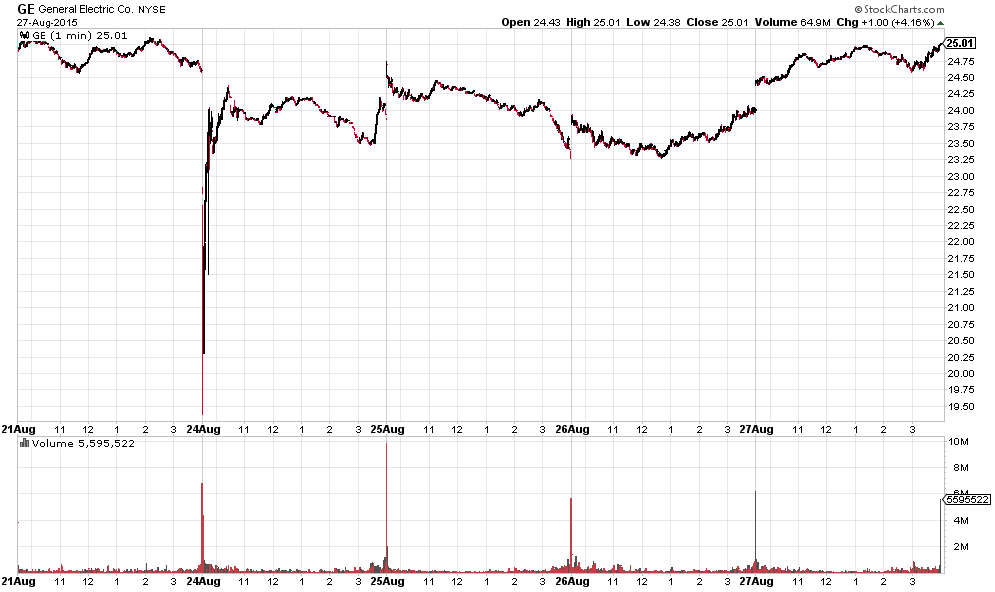
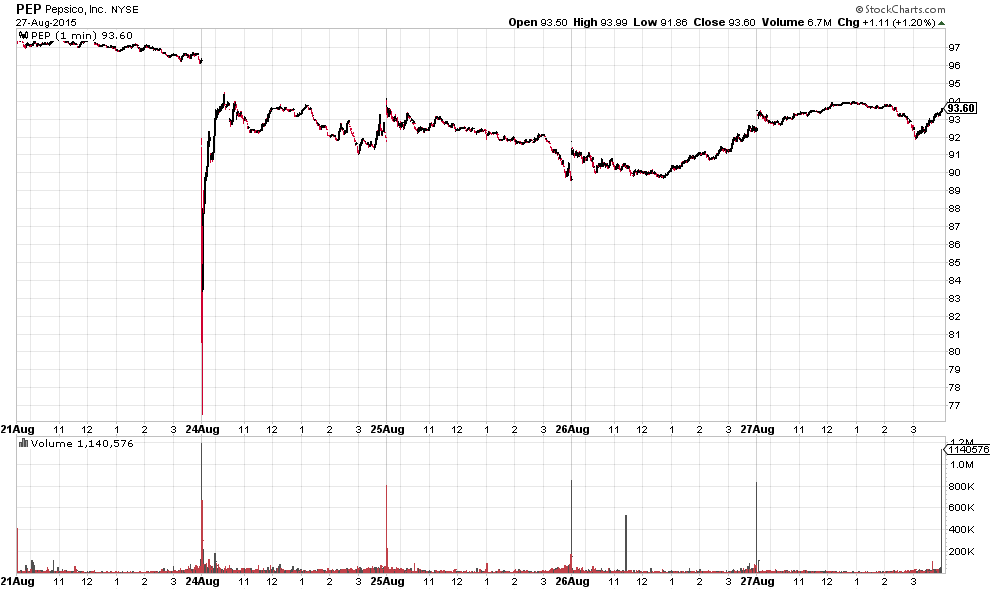
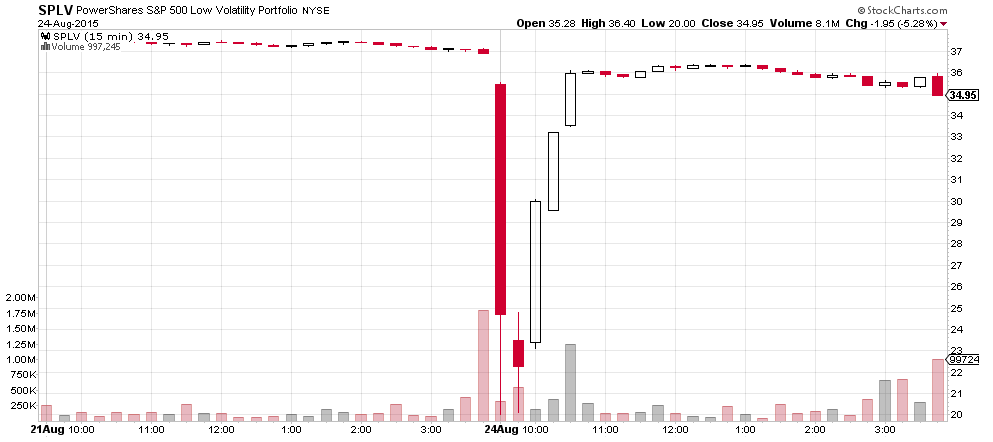
Something else happened: dozens of blue chip stocks flash-crashed, too. And not too timid (many -20% to over -50%):
GE (General Electric) has a market capitalization of $250bn (and enterprise value of more than $500bn). Pepsi 135bn. Ford 50bn. Those companies’ share prices were ripped apart like ragdolls by a pitbull. And this is the largest and most sophisticated equity market in the world?
If you had stop-loss orders in the market, you were taken to the cleaners. And if you wanted to buy some stock, many online broker websites were unreachable.
Carnage in ETF World
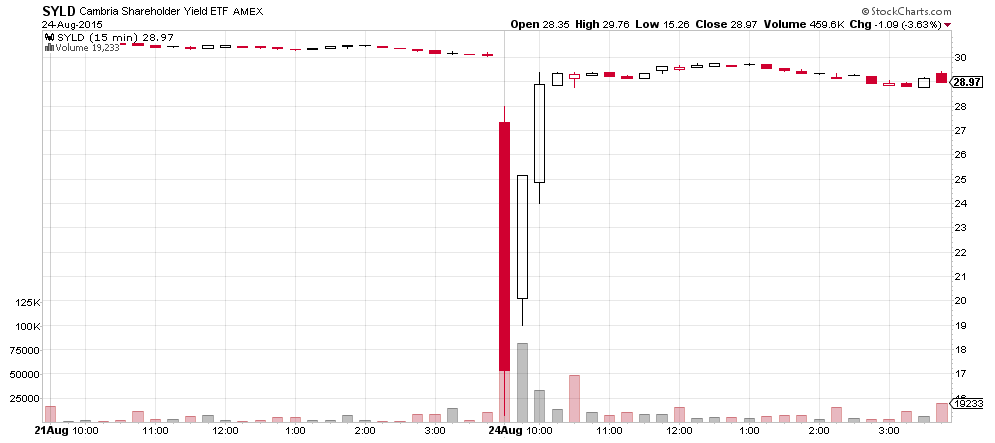
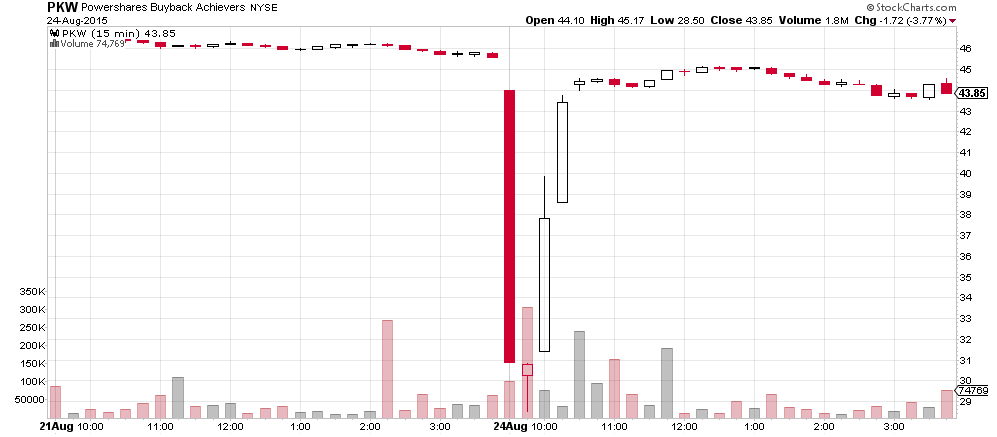
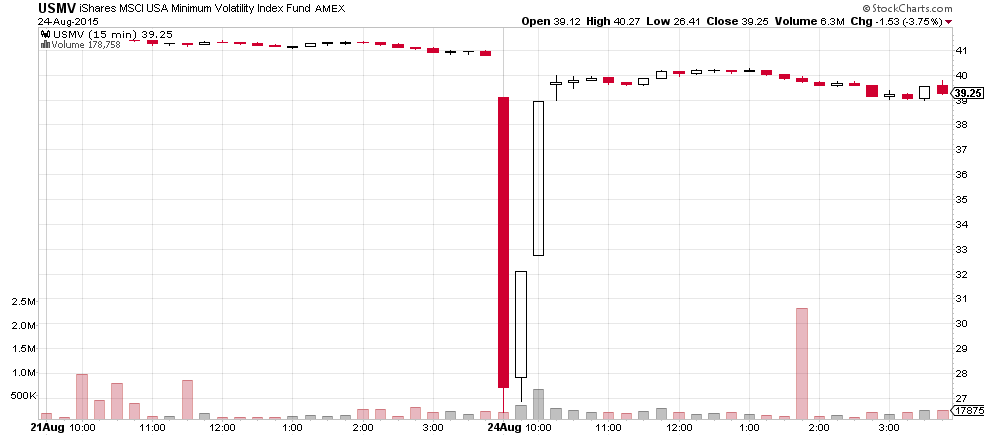
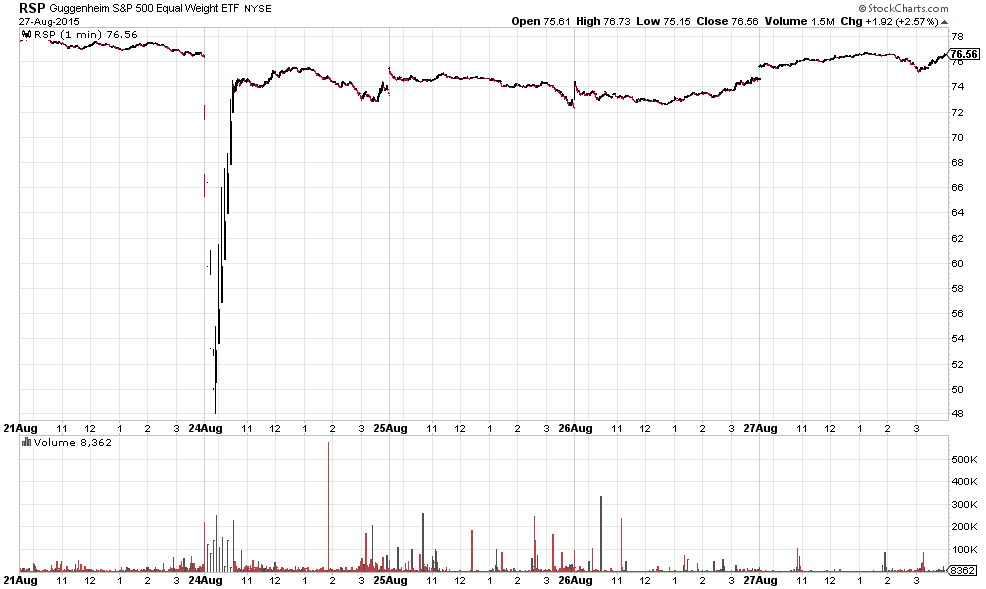
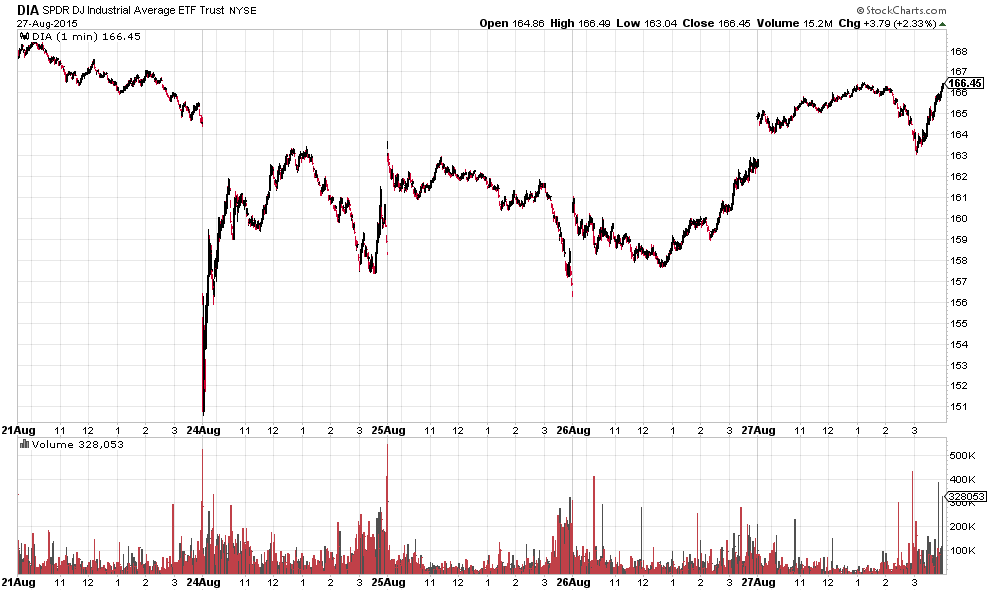
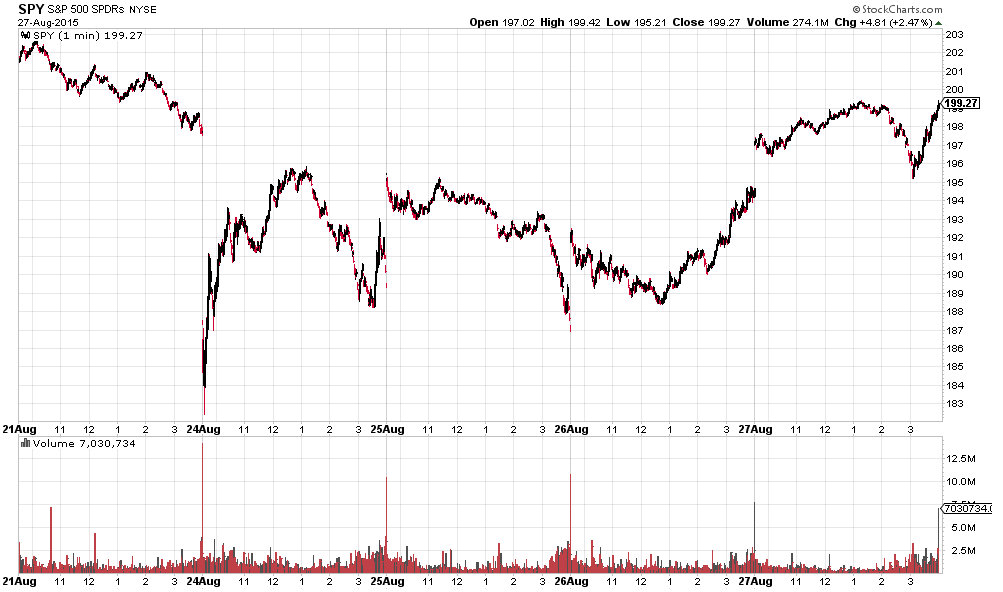
You are a “passive” investor and only have ETF’s? If you thought those were safe from flash crashes, look at these charts:
Among those ETF’s are the largest in the world (SPY). Those are not some speculative niche ETF’s. The Guggenheim S&P 500 Equal-Weight (RSP) was almost cut in half! You can see how its price kept falling despite multiple trading halts (a trading halt gives traders an opportunity to rethink their orders). And there was volume.
Volume speaks volumes
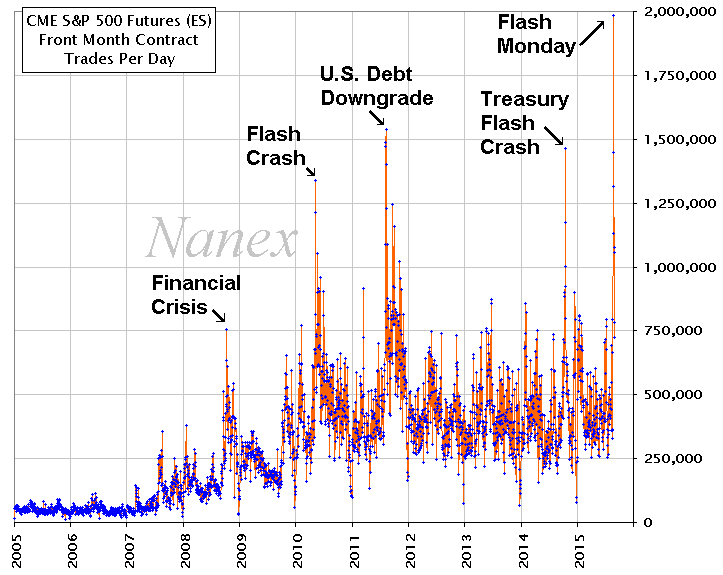
August 24th was a special day in many ways. First, the volume in stock market futures was simply off-the-chart:
Two million S&P 500 futures changed hands. Each contract equals 250 times index value, which adds up to [2m x 250 x 1,900 =] $950bn. Insane.
It gets better.
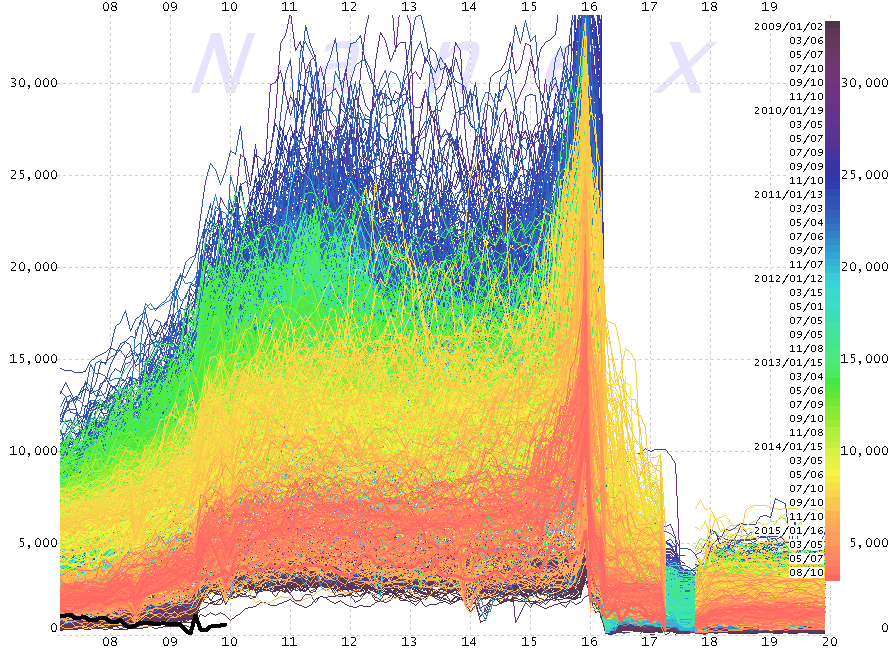
You’d think that with record volume there would be record liquidity. Wrong. Liquidity in the e-mini S&P 500 futures (1/5th of the size of its big brother) during the critical opening minutes of Wall Street was the lowest since at least 2009 (black line):
The lines represent the depth of book in number of contracts (y-axis) at any given time during the trading day (x-axis), color-coded by date (blue = oldest). The lower, the less liquidity.
What does this mean? A lot of the “liquidity” you see on “normal” days is bogus. The large majority of orders is posted by machines (or high-frequency traders, HFT), only to be withdrawn at the slightest sign of turmoil (when you needed them most).
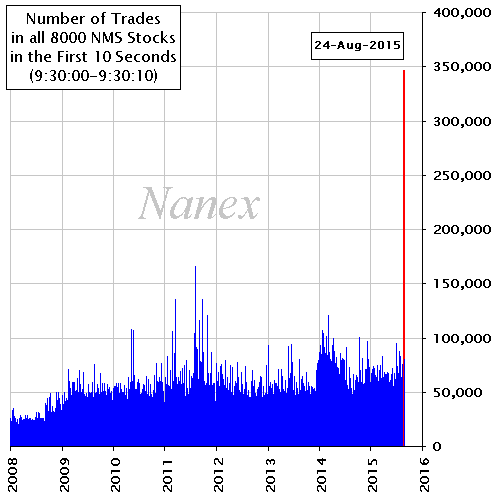
Another interesting observation is the number of trades within the first ten seconds of trading:
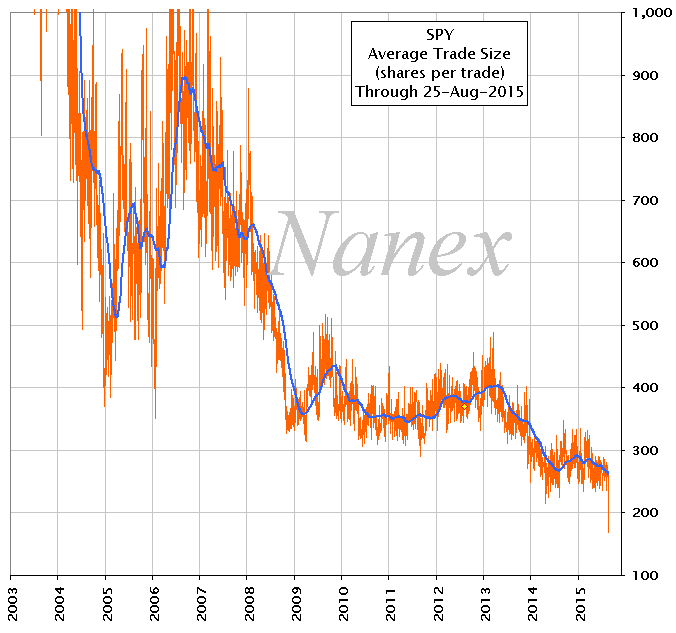
However, the average trade size (number of shares traded per trade, here in the S&P 500 ETF), reached a historic low:
Are small investors throwing in the towel (200 shares of SPY equal less than $40,000)? No, it’s again the machines, shredding large orders into thousands of small pieces to avoid detection by other machines. How do we know?
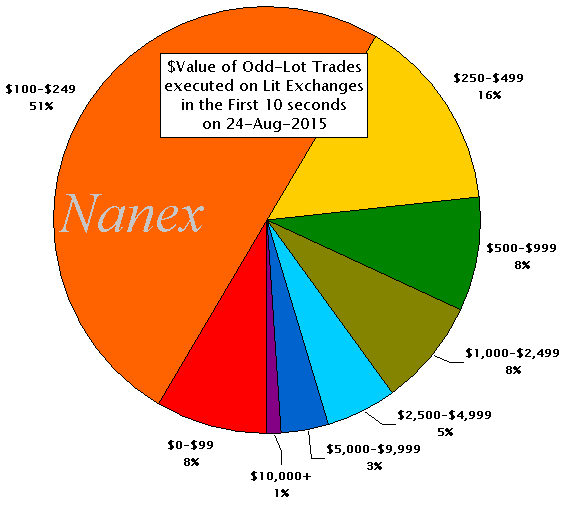
More than half of all odd-lot trades (trades with less than 100 shares) executed within the first ten seconds had a value of less than $250. If those were retail (= small investor) orders, they would get killed by trading commissions (usually $5-10 per trade even at discount brokers).
Large volume and small trades leads to a huge number of price changes. The largest ETF in the world (SPDR S&P 500 ETF, SPY) had over 500,000 price changes during regular trading on August 24 (or more than 20 per second).
But wait, there’s more.
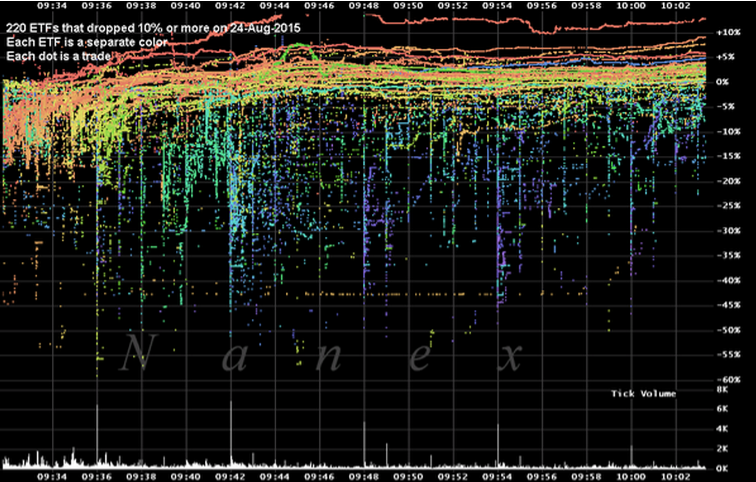
Among 220 ETF’s crashing 10% or more, a few crashed every minute on the minute (that’s when the dots fall down like rain):
Clearly non-human activity, and probably programmed by humans to behave exactly as shown.
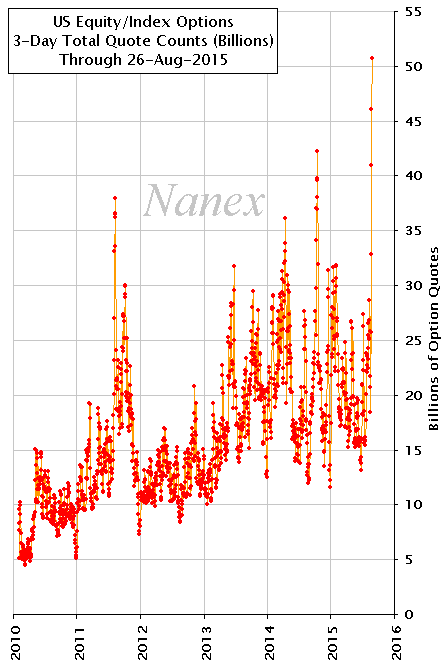
If stocks and ETF’s are fair game for HFT (high-frequency traders), so are options. The three-day period from August 24th set new records for option volume: over 50 billion quotes:
A new record of 9 million option quotes in a single second has been reached. Why the insanity, what is to be gained?
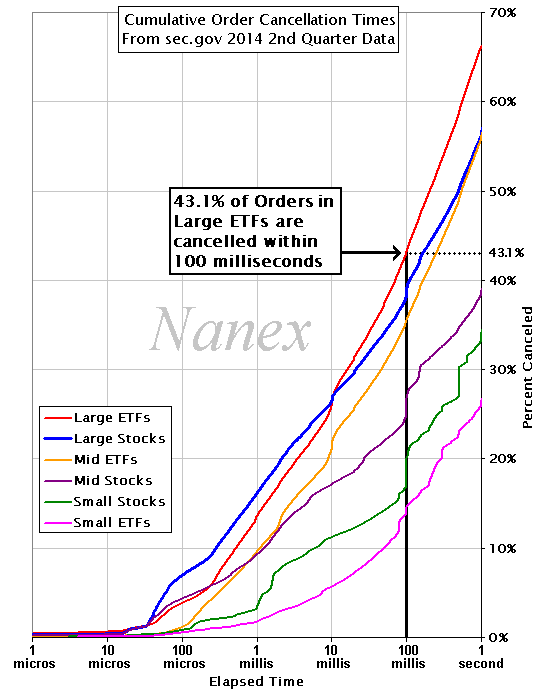
The aim is to overwhelm trading systems run by competitors or end-investors. Of all order in large ETF’s, 43% are cancelled within 100 milliseconds:
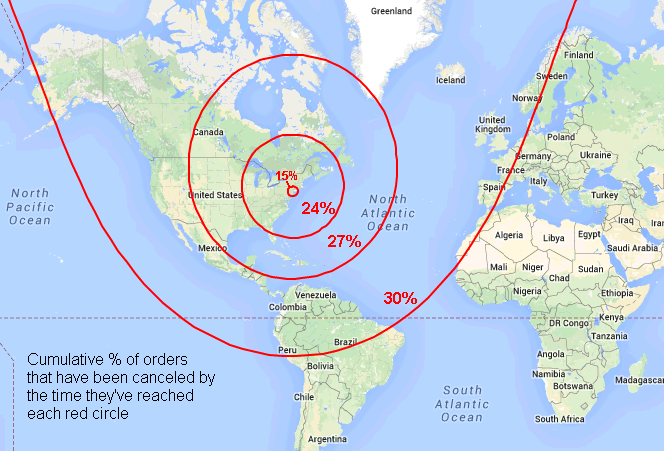
Same applies to stocks. Given the speed of light, almost one third of all orders have already expired before they reach a computer screen on the West Coast or in Europe:
And we haven’t even touched the issue of “direct access” for HFT’s (while everybody else sees data slowed-down by the “Securities Information Processor”, or SIP).
Conclusions of Part 1
- Speculative positions in volatility-related products might have aggravated, but not triggered, the Flash Crash
- The structure of the largest equity market in the world is highly unstable
- Stock exchanges, enjoying immunity from lawsuits, are supposed to be “self-regulating”. Which is akin to making the fox guard the hen house.
- The SEC (Securities Exchange Commission) is either complicit or incapable of reigning into high-frequency trading
- Phantom liquidity vanishes the moment you need it
- Flash crashes can happen any time, in any security
- Retail investors get creamed trying to sell or buy during a flash crash
- Stop-loss orders turn into loss-guaranteed-orders
- If futures are being halted and blue chip stocks crash 20-50% on no news, what will the “market” look like when actually something significant happens?
- Do you want to trust your life savings to this casino?
A link to part 2 and 3 will be found here in the coming days.
Special thanks to Eric Hunsader of Nanex for posting many charts used in this post. He can (and should) be followed on Twitter under @nanexllc.

One response to “What the hell just happened? Part 1”
[…] (for part 1, please look here) […]